About the Continuous Delivery Maturity Model
This model originates from the time when I founded and operated Praqma. A company specialized in Continuous Delivery implementation of software development processes. Praqma is now gone. The company was swallowed in an merger and acquisition process in 2019 and the model didn’t survive. It was stored away in a GitHub repository and never used again.
…until now.
History
Praqma was, in it’s early days, focusing on configuration management, version control systems, build optimization, build automation, static code analysis, test automation. Around that time we would probably refer to all that as just “CI - Continuous Integration”. In Praqma we were very engaged in the Jenkins CI community. We had developed more than 20 plugins as commission work for our clients and released them as Open Source to the community. We had a very close collaboration with CloudBees - the company behind Jenkins CI and Kohsuke Kawaguchi who originally developed Hudson (the predecessor to Jenkins) as an internal project at Sunn, and at that time he was the Jenkins CI Open Source Community lead - on CloudBees’ pay-roll.
Version 1 - CI focus
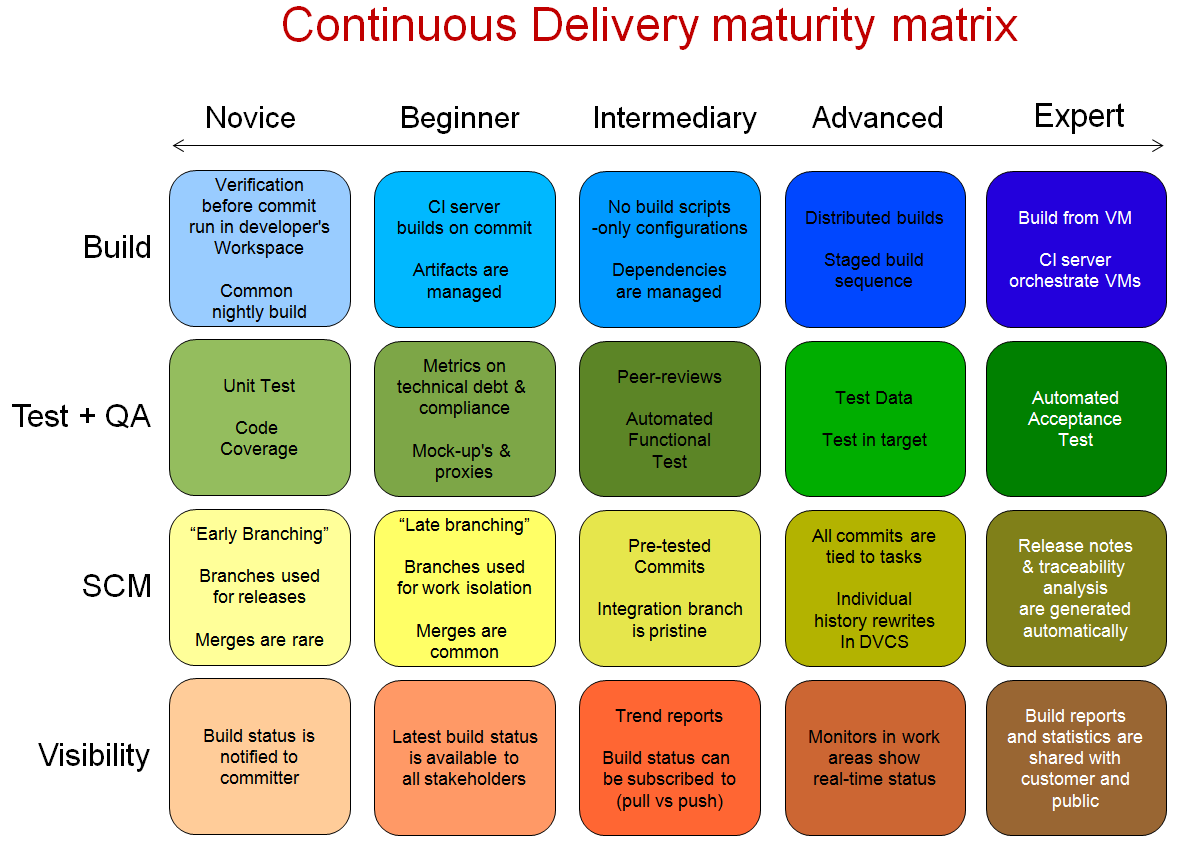
 I presented the first version of the model at the first Scandinavian Jenkins User Event in 2013. It was part of our dedicated focus to shift from being a CI company to a “CD - Continuous Delivery” company. At that debut presentation it was nothing more than a poster:
CloudBees still has a blog post online: “What is Continuous Integration?” that includes a picture of this first version.
Base on this version we developed a simple survey in a google form, and a few scripts to analyze the data. Our goal was to map the current state - and interest - in Continuous Delivery in the industry. The survey picked up more than 400 replies over the course of a just a few months.
Based on these replies and then general feedback on the survey we realized that we needed to upgrade the model - and explain it.
Version 2 - a model framework
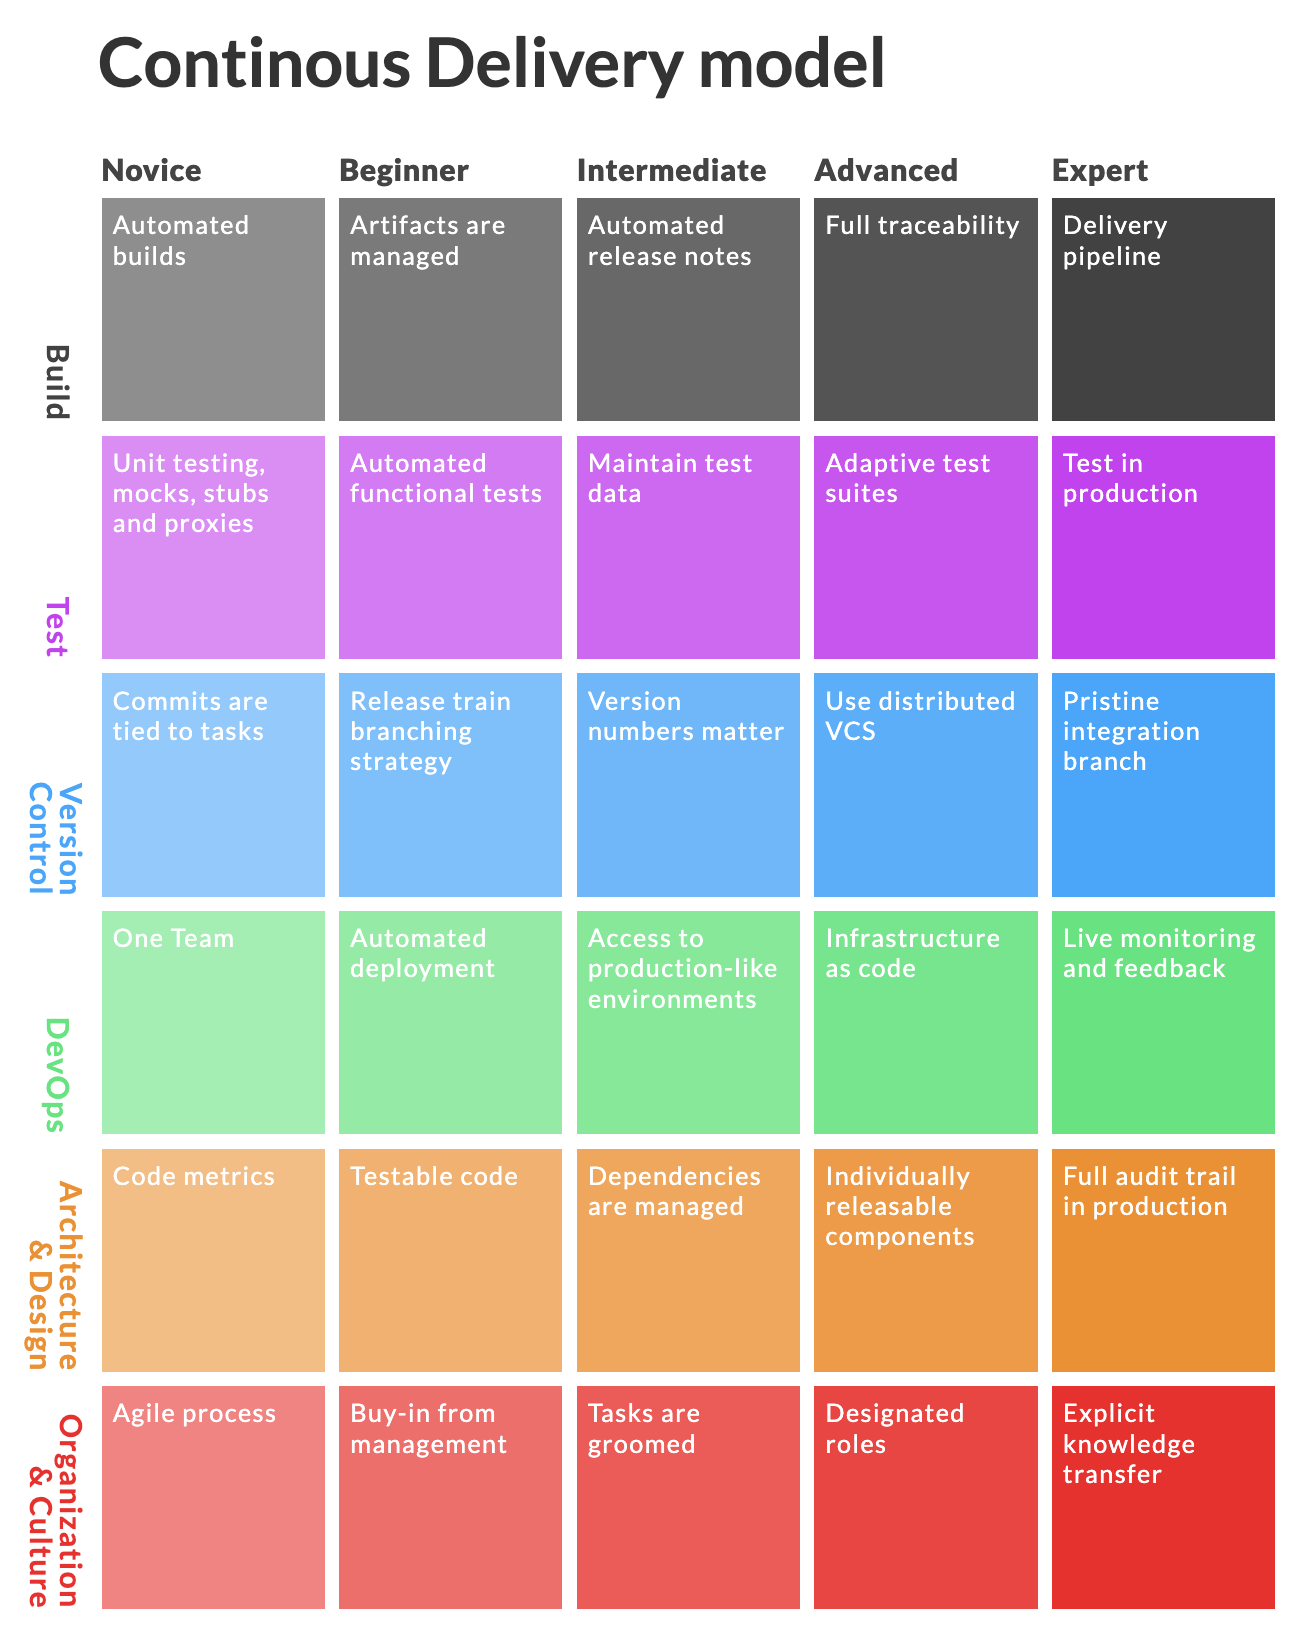
In December 2015 we released the next generation of our model. It was not only a new version of the content in the model but an entire framework build in MarkDown and Liquid to enable us to easily update the model, based on feedback, and even adapt it to specific contexts or companies.
The model was optimized specifically to be used as an assessment tool for helping companies to map their current Value streams and to build a backlog for implementing Continuous Delivery. Our assessment process was based on “The Toyota Way” principles: Value Stream Mapping, Genchi Genbutsu (observe deeply), identifying waste (muda, mura and muri), measure lead times and Continuous Improvement (kaizen) based on 5S (sort, straighten, shine, standardize, sustain).
We wanted to create a unique assessment process where it was the customer’s own employees - the contributors to the value stream - that delivered the insights, we merely facilitated the process and curated and evaluated the findings.
The assessment process we developed would span five intense workdays on-site at the customer, with all hands on deck. Some of the larger assessments we did had 120 participants in the first-day Value Stream Mapping workshop.
We game’ified the process with huge rich pictures on the wall and we developed a deck of cards - one for each tile in the matrix - which we used in different workshop formats where the participants would score the cards by four different gauges and hereby identify both “low hanging fruits” as well as “blockers”.
The model framework would build a static website, but it had a unique feature that the .pdf to print the card deck from was automatically generated on-the-fly, so any last-minute changes, adaptions or customizations to the model could be implemented in matter op minutes.
The model framework, was later extended so that event the findings we observed during the assessment - the Continuous Delivery backlog - and the report to the customer including the executive summary - was written directly into a customer specific version of the model. The result of the process was delivered to the customer both as a static website that they could read in a browser and to accompany it a 50-70 page detailed report in .pdf. A report that the model framework automatically created based on the website content.
We had made the model a living example and a show case of what we was preaching - continuous delivery, anything-as-code, in this case even the customized model, the card deck, the result of the assessment.
Practial - real life use
From late 2015 and until I left Praqma in 2018 I lead the development of this framework and Continuous Delivery assessment format and in that period I conducted 20 assessment. And we even managed to standardize the format and process to a degree where my colleagues at Praqma was able to execute the same assessment four times, without my attendance.
Praqma’s last official version of the model is captured by the Way Back Machine: code-maturity.praqma.com
A live sample - it’s just a story
Here on there pages a lakruzz.com I’m now re-publishing the model. It has received a large overhaul. Under the hood a large majority of the code is rewritten, to enhance readability in general and media queries and responsive design on handheld devices. But more importantly I’ve turned the model into a template you can inherit from in your own static website in jekyll - I’ll give a few pointers to how that can be done later. but for now I just want the release this MVP so we can get the model live again.
To show-case the features of the model I have added a anonymized and generalized write-up of some of the most typical or illustrative findings and mitigation from the total of 24 assessments that was conducted on the basis of this specific model. I started out with the three first cards in the Build area - more will follow. You can subscribe to the feed in the footer to get updates.
Any references to any the 24 companies or even the specific mentioning of their tool-stack, organization, location, domain of operation, or any data for that matter, that could possibly identify them is weeded out or scrambled.
So what is left on these pages is an example or a story of what a Continuous Delivery Assessment report based on this model could look like.
But hey! Feel free to read much more into it than just that; I can reveal to you, that a large majority of the most important findings in the various areas and levels were common and shared among many of the companies. In short; their issues and challenges were seldom unique and even if this sample assessment is not based on observations done in your specific organization I would be surprised if your weren’t able - none the less - to read some of it, as-if it was your own assessment.
How to read the model
Hit the icon in the top-left corner to go to the front of the model. You will see 5 levels of expertise - Novice, Beginner, Intermediate, Advanced and Expert. These levels are a chosen as a reference to The Dreyfus Brother’s model for skill acquisition which contributed to the field of Cognitive Science as early as in the 80’s to propose an early model for understanding intelligence.
In context of Continuous Delivery we chose to focus on six different areas of knowledge. Build, Test, Version control, DevOps, Architecture & Design and Organization & Culture. These catagories can be seen as a-sign-o-the-times - back then. You would think that some of these areas no longer impose a problem. Surely for use on modern software development products and teams these areas should be updated.
Maybe, sure! - But then again; you would be surprised how slow the world is moving - in large organizations.
I did make one specific change; In the Version Control area I moved the card “Use Distributed VCS” from the Advanced level to Novice. In the eight years that has passed git has become so much af a standard that it’s unavoidable - using git is now considered basic stuff.
Each tile in the matrix has it’s own landing-page which contains:
- A score on each of the four gauges Throughput, Feedback, Payback and Complexity and a total score, which is the sum of the effect; Throughput + Feedback + Payback.
- A short description.
- A list of findings marked with .
- Each finding is then followed up by least one, sometimes more, suggested possible mitigation marked by prioritization; High , Medium and Low
What to look for: As mentioned earlier, the gauges, the total score and the level of complexity help to easily identify:
Low hanging fruits
Findings that score high: in the range 7-9. and marked as 1st level of complexity with are low hanging fruit. These are issues that would have a huge impact and that are relatively easy or simple to implement.
Team efforts
Findings that score high: in the range 7-9. and marked as 2nd level of complexity with are team efforts. They are probably more important than some of your low-scoring low-hanging fruits, but easy to overlook, because they are not necessarily easy.
Mountains to climb
Findings that score relatively high in in the range 7-9 and marked as 3rd level of complexity with are Mountains to climb — or even blockers. They can be equally important to fix as the low hanging fruits but due to the nature of these; they are difficult and often expensive, maybe even impossible to fix. So teams and organizations tend to ignore them.
